#ElectionWatch: Distorted Data for Turnout in Russia
Opposing sides present differing data in the aftermath of elections in which widespread tampering was evident
#ElectionWatch: Distorted Data for Turnout in Russia
Opposing sides present differing data in the aftermath of elections in which widespread tampering was evident

While the winner of the 2018 Russian presidential elections on March 18 was unsurprising, all eyes were on voter turnout as an indicator of legitimacy — or illegitimacy. Vladimir Putin secured the presidential seat with 76.66 percent. Second at polls was the leader of a self-proclaimed “Communist Party” Pavel Grudinin (11.8 percent) followed by ultranationalist Vladimir Zhirinovsky (5.66 percent). The only female candidate, Kseniya Sobchak, who unexpectedly joined the race in October 2017, came in fourth with 1.67 percent of the vote. The results were published by the Russian Central Election Commission (CIK or ЦИК).
The results also matched the pre-election polls. Nevertheless, the main intrigue was election turnout.
In December 2017, the most visible Kremlin opponent Alexey Navalny called for a boycott of the elections, meaning to not participate in them at all. The call branded as “Zabastovka” (забастовка — a boycott) was boosted during the nation-wide protests on January 28.
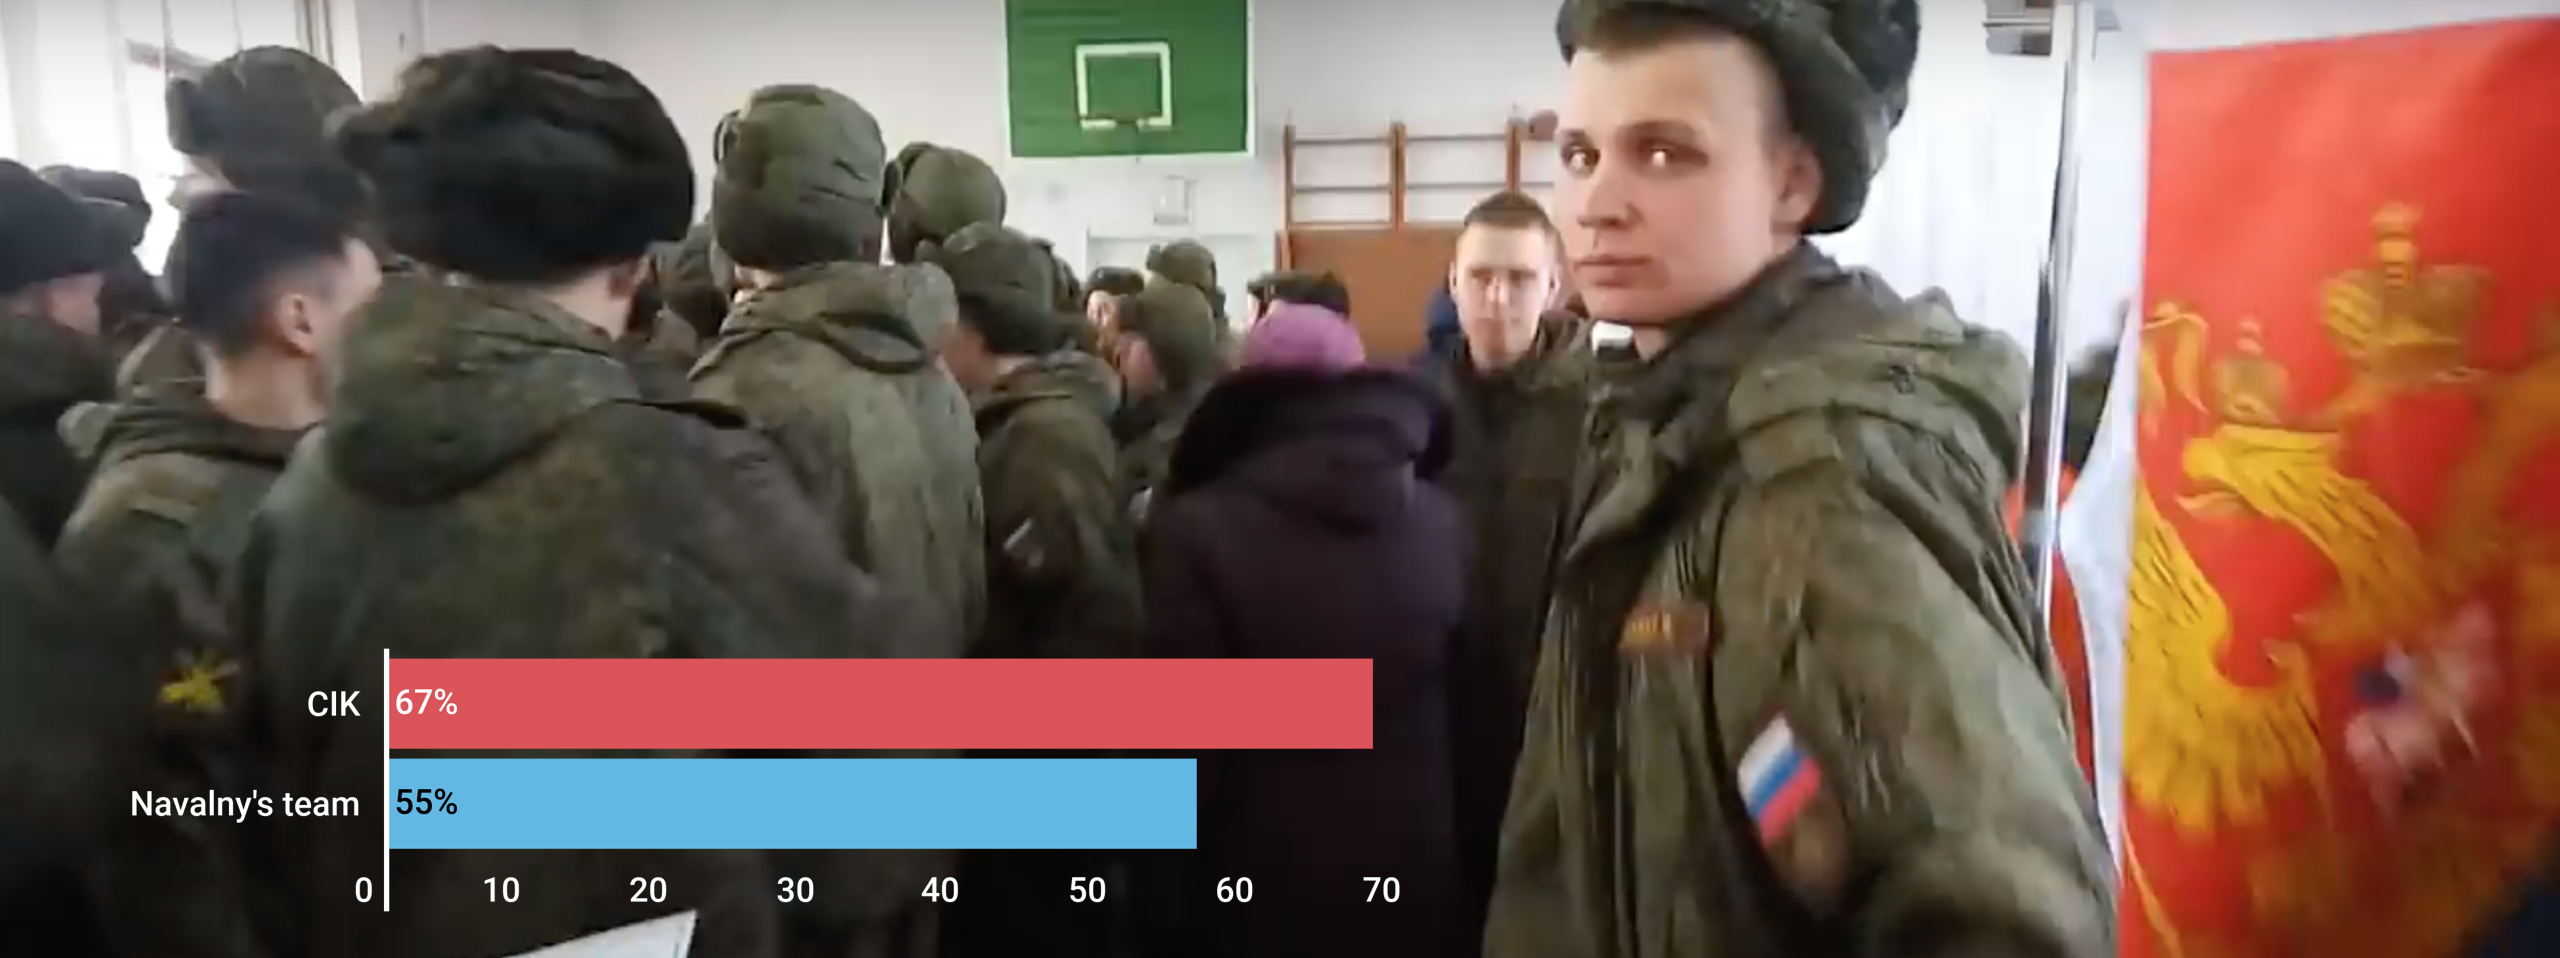
Simultaneously, the Central Election Commission carried out an unprecedented information campaign to boost the turnout. It involved viral videos targeted at youth, as well as offline promotions, contests, discounted food, health tests, and coercive measures. A month before the elections, citizen participation was predicted to be 80.4 percent. CIK’s efforts resulted in a 67.49 percent turnout, as reported the day following the elections.
This figure does not match with data gathered by Navalny’s team who mobilized 33,214 observers. Navalny’s observers made about a third from the whole number of observers appointed by the parties of the candidates. According to Navalny’s team, the real election turnout within the country was 55 percent.

Navalny’s team registered significant discrepancies in several federal statistics in Russia. In Tyva Republic, for example, official turnout data reported on March 21 by Tuva regional media outlet was 93.66 percent, whereas Navaly’s team reported the turnout of 76 percent. The Caucasus exhibited the highest concentration of inflated numbers, with Navalny’s team reporting a discrepancy as high as 63 percent in Kabardino-Balkaria.
On March 20, the Twitter account of Navalny’s election observers in Chechnya posted about significant differences between turnout results in the observed polling stations, and turnout in the polling stations without observers.
Мы вернулись в Москву! Спасибо, что читали нас. В Грозном явка на участках с независимыми наблюдателями составила в среднем 55,14% против 88,62%, где наблюдателей не было
Можем повторить 😎#Невыборы2018 #Грозный2018 pic.twitter.com/0WXMJ9CpWf
— Dozor.academy (@Dozor_Academy) March 20, 2018
Russian media outlet “Vedomosti” also produced maps of turnout based on CIK data. The outlet concluded that the turnout dropped in at least 30 territorial subdivisions but rose in all other 55 subdivisions.

Unfortunately, there was no alternative data on voter turnout from 2012 to challenge the official data comparison or use as a broader reference point.
Turnout numbers inflated?
The difference between the overall turnout reported by Navalny’s team is 12 percent less than officially reported. Nevertheless, both results are characterized by underlying agendas, as Navalny’s team has a stake in reporting lower numbers and prove the “Zabastovka” campaign succeeded.
On March 20, Radio Freedom published an interview with an electoral statistician Sergey Shpilkin who outlined a few pieces mathematical of evidence of an extent to which the turnout and election results were inflated.
First, some electoral districts reported similar and round turnout data across dozens of polling stations, that is mathematically highly improbable.
Second, another statistical anomaly was observed. In polling stations with lower turnout, the “main candidate” received only 50 percent of all votes. At the same time in polling stations with a turnout of 90 percent or more, the “main candidate” received high support. This contradicts the normal distribution of votes that should be steady regardless the turnout. Below is an example of Karachay-Cherkessia Republic, where the ratio of votes for Vladimir Putin “spiked” in the polling station with the highest turnout reported.

Shpilkin explained to Radio Freedom that the effect of correlation between turnout and vote percentage for the main candidate could be due to ballot stuffing or falsification of the results. On Sunday, March 18, @DFRLab identified and verified multiple cases of ballot stuffing.
YouTube channel Navalny LIVE also published a video compilation of the ballot stuffing.
Shpilkin concluded that overall about 10 million illegitimate ballots were stuffed for the “main candidate”. He explained his conclusion:
For example, we take all the polling stations in Russia, where the turnout was 69 to 70 percent, and sum up all the votes for Vladimir Putin in these areas. The resulting value is plotted vertically at the point 70 horizontally. In a graph, you can often see that the “right wing” of the “main candidate” is suspiciously higher, while in case of other candidates it is almost symmetrical. To understand what the real picture looked like, the right side of the chart is just taken from the results of an “ordinary” candidate, and shifted a little. Everything higher is an anomaly, the area of this site is the number of voices stuffed in.
The “Zabastovka” results
On March 20, Navalny published a blog post about his evaluation of “Zabastovka” and the elections. The post read:
Everything is simple with “Zabastovka”. Why was it successful?
We said: do not let them go to the polls, we will boycott and drop the turnout so much that you will again have to make massive falsifications, as in 2011. And everyone will see — Putin was elected in fraudulent elections.
And Putin answered: No, I will use an administrative resource to get as many people, so the election turnout will be higher than in 2012.
Well, that’s it. Since then, all these “elections” have turned into a confrontation between the staff of “Zabastovka” and the Kremlin headquarters to blow the turnout up. It was a political process. We relied on honest and brave people. They on a power and administrative resource.
Nevertheless, quite a few social media users reflected on “Zabastovka” as a failure.
Rustem Adagamov, a Russian blogger and supporter of Kseniya Sobchak, tweeted:
Не хочется писать «а ведь вас предупреждали, что этим все закончится». Но посмотрите сами во что превращается эта ваша «забастовка». 🙁 pic.twitter.com/NqQFOfM7Fb
— Рустем Адагамов (@adagamov) March 18, 2018
Similarly, a Kremlin opponent, a member of a liberal party “Yabloko” and the director of the “City Projects” foundation Maksim Kac tweeted:
Итоговая явка: 66,7% на текущий момент. Количество голосов за Путина 56,2 миллиона. И то и другое больше чем в 2012 году.
Даже в Москве у Путина 71% получился.Ну и как, сработала забастовка? Сильно упала легитимность?
— Максим Кац (@max_katz) March 19, 2018
Also, the Chairman of the State Duma Vyacheslav Volodin told Russian media outlet RBC that the high turnout was a response to “Zabastovka” campaign. He said:
Citizens responded to Mr. Navalny on his initiative with a higher turnout.
It is hard to evaluate the true impact of “Zabastovka”. One of the most engaged tweets on “Zabastovka” concluded that it did not matter.
https://twitter.com/coelumm/status/975526072388345858
Conclusion
Navalny’s team measured a 12 percent difference between actual turnout rates and officially reported numbers. It is important to keep in mind that Navalny is not an impartial actor, and without absolute transparency, nothing can be confirmed. The statistical analysis on the turnout data suggests that at least 10 million ballots were stuffed in favor of the “main candidate”. The call to boycott the elections branded as “zabastovka” did not have a notable impact on the election turnout.
Follow along for more in-depth analysis from our #DigitalSherlocks.