VK Vanishing in Ukraine?
One month later, measuring the impact of banning certain websites in Ukraine
VK Vanishing in Ukraine?

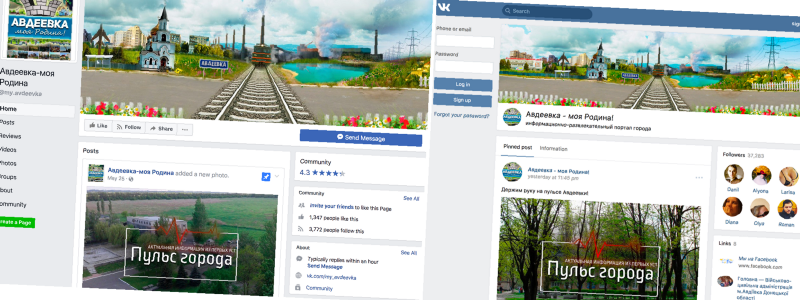
BANNER: “Avdiivka — My homeland!” pages on Facebook (left) and VK (right).
Late on May 15, 2017, Ukrainian President Petro Poroshenko announced a ban on a number of popular Russian websites, including Yandex and the social networks ВКонтакте (VK) and Odnoklassniki. This ban was widely covered the following morning, May 16.
Shortly after the online ban, @DFRLab published an analysis of “what’s being lost” with this ban, focusing on popular online communities for Ukrainian citizens living on the front lines. In this analysis, we noted that 78% of online Ukrainians had accounts on VK and reported:
There has been an early surge of Ukrainians moving towards Facebook, as seen in the creation and increase of membership in Ukrainian Facebook pages and groups, but the number of participants is still dwarfed by their VK counterparts.
Over a month after the ban was announced, what can we say about the overall use of VK and Facebook for Ukrainian citizens living on the front lines of the war in the Donbas?
Avdiivka, my homeland!
In our investigation, we used the VK and Facebook group for “Avdiivka — My homeland!” (Авдеевка — моя родина!) to measure the general trends of engagement, and disengagement, of social networks in Ukraine. We chose this particular online group across two social media platforms for a number of reasons:
— Avdiivka is one of the most densely populated government-controlled cities on the front line, making it an important flash point of the conflict to measure the activity of civilians. This online forum of the group is used frequently by locals for information about the war, the status of services (such as clean water), and potential humanitarian aid. Therefore, we can say that this group is used for information to improve the health and livelihood of local residents, and not just an engagement group with memes, funny videos, and so on.
— The online group is pro-Ukrainian, meaning that many users of the group may be inclined to voluntarily avoid the use of Russian sites and not seek alternative methods, such as VPNs, of accessing these sites.
— The online group is extremely active, with tens of thousands of users on VK and numerous posts every day, providing a large data set.
— The online group had parallel Facebook and VK pages before and after the ban, providing a relatively rich sample of data to measure trends of user migration.
The data
For our data set, we collected the number of likes, shares, comments, and views (on VK only) for 1799 posts on the VK and Facebook pages of “Avdiiva — my Homeland!” from May 3 (two weeks before the announced ban) to June 22, 2017. Every day, posts were made on the group’s VK and Facebook pages with roughly the same topics and content. For example, on May 8 and 9, both of the group’s the Facebook and VK pages posted mostly the same photographs and videos related to Victory Day, celebrating Soviet victory over Nazism in World War II. You can view and download our data set here on Google Docs.
In each of the following graphs, the vertical red line indicates May 15, 2017 — the date when President Poroshenko announced the ban on Russian sites in Ukraine. Due to the inconsistent implementation of this ban, there are not reliable dates to assess when each Ukrainian internet service providers (ISP) and telephone service implemented the requested bans.
Vanishing VK?
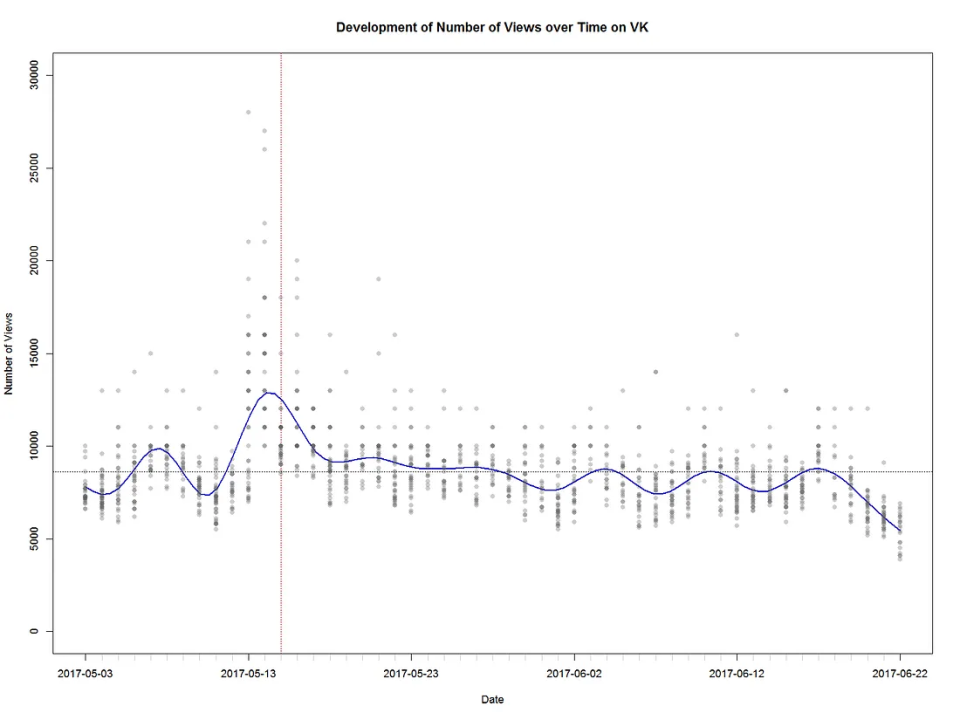
There was a large spike in the group’s activity on VK and Facebook around May 15 from two primary events. The first event was the tragic May 13 deaths of four civilians, which occurred while they were visiting their home in Avdiivka and left a young boy orphaned. Posts related to this event led to a large spike before the ban; some posts gained over 20,000 views. The other major event was the announcement of the ban itself, which led to a large number of users accessing the site for news on the ban and, presumably, the online group’s future on VK. Here we see a slight general trend downward for the number of views that posts on the VK page generate through the end of May and June. However, the lowest dip at June 21 and 22 is partially due to a smaller window of opportunity for users to view the content.

Flight to Facebook?
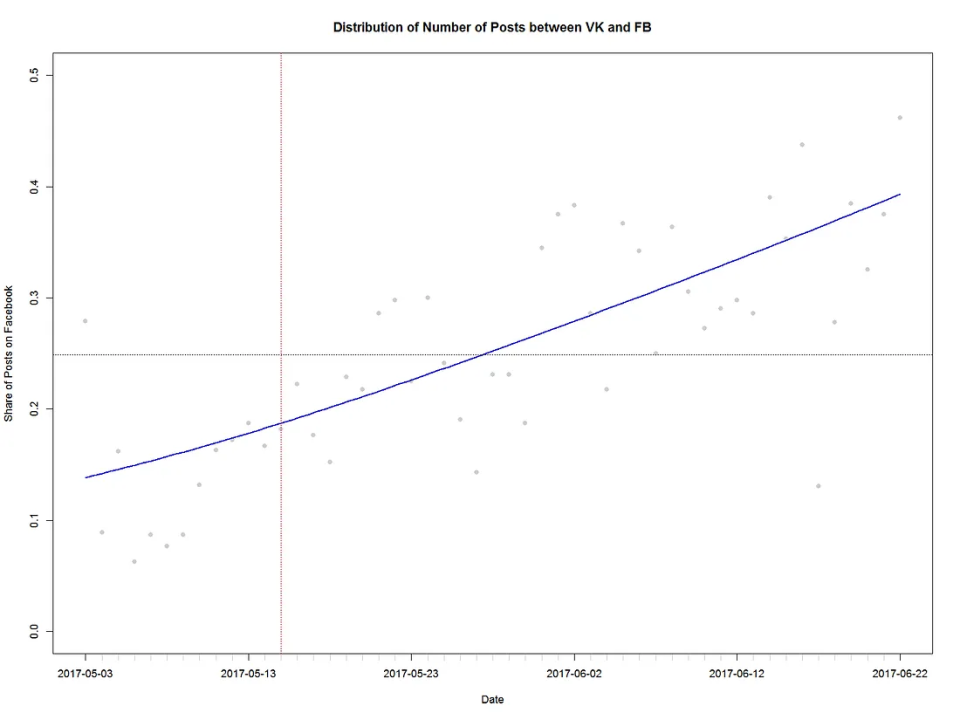
The administrators of the Avdiivka group also made a concerted effort in providing more content on their Facebook page after the ban. As seen in the chart below, there was a huge increase in the share of Facebook posts per day after the ban, compared to the amount of content posted on the more popular VK page. While there were only a handful of Facebook posts a day in early May, the number of posts increased to sometimes a dozen or more a month after the announced ban. However, the number of VK posts stayed relatively stable before and after the ban.
The measurement we used was the share distribution of Facebook posts to total posts, thus, Facebook posts divided by the sum of Facebook and VK posts. This means that if there were an equal number Facebook and VK posts on a day, the share distribution of posts on Facebook would be 0.50. On May 5, there were six Facebook posts and 31 VK posts, meaning that the Facebook share was 0.16. In other words, 16 percent of the posts between the two pages were on Facebook. On June 22, the share distribution dramatically increased on the group’s Facebook page, with 18 posts compared to 21 VK posts, equaling a Facebook share distribution of 0.46, meaning that 46 percent of the group’s posts that day were on Facebook.

Facebook engagement up, but VK still reigns
Providing content is only half of the equation. Did Ukrainian online community members follow the lead of the Avdiivka group administrators, who shifted their activity to the group’s Facebook page, in accordance with the country’s VK ban? On June 7, the Ukrainian research group Watcher published a report, which found that Facebook added 2.2 million real users in Ukraine during the two weeks after the announced ban, while VK lost 3.7 million real users in Ukraine over in the same period. Analysis of the share distribution of daily user engagements — which include likes, shares, and comments — on the content on the Avdiivka Facebook page compared to its VK page showed these numbers materialize.

Like the previous chart, these statistics indicate the share of Facebook engagements compared to the total number of VK and Facebook engagements, thus a 0.50 distribution would indicate equal number of VK and Facebook engagements on a day. The drop in the final days is difficult to assess, as it could show a trend of user disengagement from Facebook a month after the ban, but it could also reflect a smaller window of opportunity for users to engage with the content. What is clear is that there are still far more user engagements per post on VK compared to Facebook — on only three days did users provide even one-fifth the number of engagements on Facebook compared to VK.
What’s next?
Our data shows us that many Ukrainians living on the front lines of the war in the Donbas are migrating to Facebook from VK. The “Avdiivka — my homeland!” group remains important to monitor because it provides information that is vital to the health and livelihood of local residents, meaning that user disengagement from the group would lead to a vacuum that would need to be filled by another information portal or messaging system, including apps like Viber and WhatsApp.
While there has been a noticeable shift in Ukrainian user engagement on Facebook and disengagement from VK, it is important to not overstate this shift, as VK is still far more popular than Facebook throughout Ukraine. In the following months, we could see a rebound effect of users moving back to VK if the use of VPNs becomes more common place, or if users are not comfortable with the interface of Facebook after their initial migration. We will continue to monitor the effects of this online ban, especially with a focus on the online use of communities living with the harshest consequences of the war.
Thanks to Bellingcat’s Klement Anders on data analysis and visualization. You can access the entire data set here, on Google Docs.

